
Page 102 - OUSD LCAP 2016-19
P. 102
Page 88 of 119
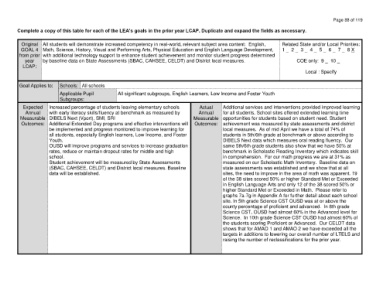
Complete a copy of this table for each of the LEA’s goals in the prior year LCAP. Duplicate and expand the fields as necessary.
Original All students will demonstrate increased competency in real-world, relevant subject area content: English, Related State and/or Local Priorities:
GOAL 4 Math, Science, History, Visual and Performing Arts, Physical Education and English Language Development, 1 2 3 4 5 6 7 8 X 8
from prior with additional technology support to enhance student achievement and monitor student progress determined
year by baseline data on State Assessments (SBAC, CAHSEE, CELDT) and District local measures. COE only: 9 10 0
LCAP:
Local : Specify
Goal Applies to: Schools: All schools
Applicable Pupil All significant subgroups, English Learners, Low Income and Foster Youth
Subgroups:
Expected Increased percentage of students leaving elementary schools Actual Additional services and interventions provided improved learning
Annual with early literacy skills/fluency at benchmark as measured by Annual for all students. School sites offered extended learning time
Measurable DIBELS Next (Vport), SMI, SRI Measurable opportunities for students based on student need. Student
Outcomes: Additional Extended Day programs and effective interventions will Outcomes: achievement was measured by state assessments and district
be implemented and progress monitored to improve learning for local measures. As of mid April we have a total of 74% of
all students, especially English learners, Low Income, and Foster students in 5th/6th grade at benchmark or above according to
Youth. DIBELS Next data which measures oral reading fluency. Our
OUSD will improve programs and services to increase graduation same 5th/6th grade students also show that we have 50% at
rates, reduce or maintain dropout rates for middle and high benchmark in Scholastic Reading Inventory which indicates skill
school. in comprehension. For our math progress we are at 31% as
Student achievement will be measured by State Assessments measured on our Scholastic Math Inventory. Baseline data on
(SBAC, CAHSEE, CELDT) and District local measures. Baseline state assessments was established and we show that at all
data will be established. sites, the need to improve in the area of math was apparent. 19
of the 38 sites scored 50% or higher Standard Met or Exceeded
in English Language Arts and only 12 of the 38 scored 50% or
higher Standard Met or Exceeded in Math. Please refer to
graphs 7a-7g in Appendix A for further detail about each school
site. In 5th grade Science CST OUSD was at or above the
county percentage of proficient and advanced. In 8th grade
Science CST, OUSD had almost 60% in the Advanced level for
Science. In 10th grade Science CST OUSD had almost 60% of
the students scoring Proficient or Advanced. Our CELDT data
shows that for AMAO 1 and AMAO 2 we have exceeded all the
targets in additions to lowering our overall number of LTELS and
raising the number of reclassifications for the prior year.