
Page 137 - OUSD LCAP 2016-19
P. 137
APPENDIX A
Implementation of State Standards
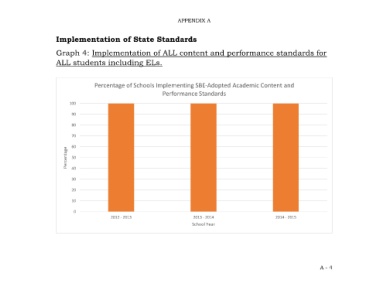
Graph 4: Implementation of ALL content and performance standards for
ALL students including ELs.
Percentage of Schools Implementing SBE-Adopted Academic Content and
Performance Standards
100
90
80
70
60
Percentage 50
40
30
20
10
0
2012 - 2013 2013 - 2014 2014 - 2015
School Year
A - 4