Page 141 - OUSD LCAP 2016-19
P. 141

APPENDIX A


                        Pupil Achievement

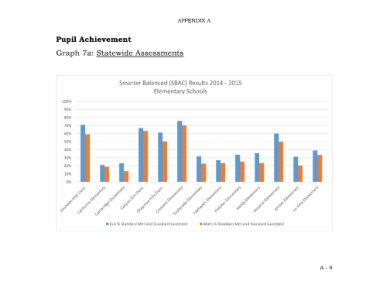
                        Graph 7a: Statewide Assessments


                                                   Smarter Balanced (SBAC) Results 2014 - 2015
                                                                 Elementary Schools

                           100%
                            90%
                            80%
                            70%
                            60%
                            50%
                            40%
                            30%

                            20%
                            10%
                             0%


                                               ELA % Standard Met and Standard Exceeded  Math % Standard Met and Standard Exceeded


                                                                                                                                      A - 8
   136   137   138   139   140   141   142   143   144   145   146