
Page 142 - OUSD LCAP 2015-2016
P. 142
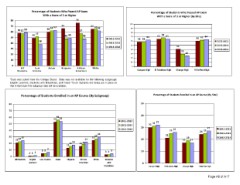
Percentage of Students Who Passed AP Exam                                                  Percentage of Students Who Passed AP Exam
                                  With a Score of 3 or Higher                                                           With a Score of 3 or Higher (By Site)

80 76

                                                 66                                                100
                                                    48 49
70                                60 62 63                               65 65 62                  90
60 58 57 59
                       49 52                                 57                                    80             65 68 65                                            60 62 64
50                            38                                48                                                                                                  Villa Park High
                                                                                                   70 63
40                                                                                 2011-2012               58 58                                                                     2011-2012
                                                                                   2012-2013                                                                                         2012-2013
                                                                                   2013-2014       60                                                                                2013-2014

30                                                                                                 50 41

20                                                                                                 40

                                                                                                                                                                29
                                                                                                   30 25

                                                                                                   20

10

                                                                                                   10

    0                     Lo w    A sian         H ispanic     A frican  White                     0
                       Inco me                               A merican
                 A ll                                                                                    Canyon High El Modena High Orange High

           Students

*Data was pulled from the College Board. Data was not available for the following subgroups:
English Learners, Students with Disabilities, and Foster Youth. Systems are being put in place so
that in the future this subgroup data will be available.

    Percentage of Students Enrolled in an AP Course (By Subgroup)                                                          Percentage of Students Enrolled in an AP Course (By Site)
                                                                                                              50
80

70

60                                         56  54                                                             40
                                        53                                                                             30 31 32
                                                                                                   2011-2012
50                                                                                                 2012-2013  30
                                                                                                   2013-2014
40                                                                                                            20                     25 26                                   27       2011-2012
                                                                                                                                 21                                 24 25             2012-2013
                                                                               30                                                                                                     2013-2014
30 212325                                                          22    2527                                                                   19
20                                                           16 19                                                                          17 17
                                                   1316 18

10                                55 7                                             33 5                       10

                       11 2

0

    All Students English Low Income       Asian    Hispanic   African    White      Students
                                                             American                 with
                       Learners                                                                               0
                                                                                   Disabilities
                                                                                                                       Canyon High El Modena High Orange High       Villa Park High

                                                                                                                                                                    Page A8 of A17