
Page 140 - OUSD LCAP 2015-2016
P. 140
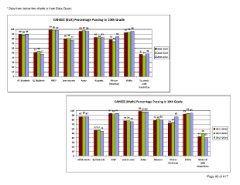
* Data from below two charts is from Data Quest.

                                  CAHSEE (ELA) Percentage Passing in 10th Grade

100                               99 98 97    80 81 77  96 97 96  83 83               84  93 94 96                    2011-2012
          89 88 89                  RFEP    Low Income    Asian       82      78                            47 44 48  2012-2013
                                                                                                                      2013-2014
 90                                                               Hispanic        74
 80                                                                                       White        Students
 70                                                                            African                    with
 60 51 53                                                                     American
 50 47                                                                                                Disabilities
 40
 30
 20
 10

   0
        All Students EL Students

                                                                              CAHSEE (Math) Percentage Passing in 10th Grade

                                            100                               94 93 94                99 97 97                               93 94 95
                                             90 87 8787                         RFEP                    Asian
                                             80                                             78 78 76                  79 8280            87
                                             70                                           Low Income                  Hispanic       74
                                             60 57 57 55                                                                         73
                                             50
                                             40                                                                                                            49        2011-2012
                                             30                                                                                                        43 41         2012-2013
                                             20                                                                                                                      2013-2014
                                             10
                                               0                                                                                  African    White      Students
                                                    All Students EL Students                                                     American                  with

                                                                                                                                                       Disabilities

                                                                                                                                                       Page A6 of A17