Page 141 - OUSD LCAP 2015-2016
P. 141

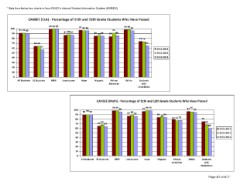
* Data from below two charts is from OUSD’s Internal Student Information System (AERIES).

CAHSEE (ELA) - Percentage of 11th and 12th Grade Students Who Have Passed

100 91 91 90                      99 99 99              97 96 96                  91       98 98 96
 90                                 RFEP                  Asian               84 86
                                             87 88 87             85 8685
 80                                         Low Income            Hispanic                             74 73
 70 64 64                                                                                                      65
 60 57
 50                                                                                                                2011-2012
 40                                                                                                                2012-2013
                                                                                                                   2013-2014
 30
 20                                                                            African     White      Students
                                                                              American                   with
 10
   0                                                                                                 Disabilities
        All Students EL Students

                                                                  CAHSEE (Math) - Percentage of 11th and 12th Grade Students Who Have Passed

                                            100 90 9090                       99 99 96                 97 99 99                         97 96 95
                                             90                                 RFEP                     Asian
                                                                                            87 89 86               84 8584    80 77 78            75
                                             80                                            Low Income              Hispanic                           68
                                             70 65 68 64
                                                                                                                                                          60
                                             60
                                                                                                                                                                2011-2012
                                             50                                                                                                                 2012-2013
                                                                                                                                                                2013-2014
                                             40
                                                                                                                               African  White      Students
                                             30                                                                               American                with

                                             20                                                                                                   Disabilities

                                             10

                                               0
                                                    All Students EL Students

                                                                                                                                                  Page A7 of A17
   136   137   138   139   140   141   142   143   144   145   146