
Page 173 - OUSD LCAP 2016-19
P. 173
APPENDIX A
School Climate
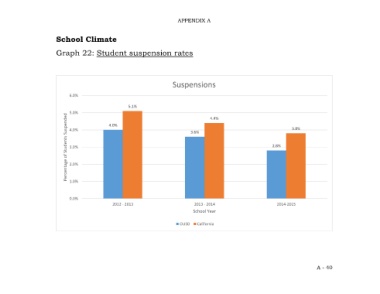
Graph 22: Student suspension rates
Suspensions
6.0%
5.1%
5.0% 4.0% 4.4% 3.8%
Percentage of Students Suspended 4.0% 3.6% 2.8%
3.0%
2.0%
1.0%
0.0%
2012 - 2013 2013 - 2014 2014-2015
School Year
OUSD California
A - 40