Page 169 - OUSD LCAP 2016-19
P. 169

APPENDIX A


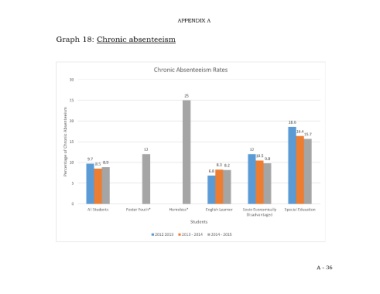
                        Graph 18: Chronic absenteeism


                                                                 Chronic Absenteeism Rates

                              30


                                                                              25
                              25
                             Percentage of Chronic Absenteeism  20  9.7  8.9  12                         12  10.5  9.8   18.6 16.4 15.7


                              15


                              10


                               5         8.5                                            6.8  8.3 8.2


                               0
                                     All Students     Foster Youth*     Homeless*      English Learner  Socio Economically  Special Education
                                                                                                        Disadvantaged
                                                                                Students

                                                                  2012 2013  2013 - 2014  2014 - 2015


                                                                                                                                     A - 36
   164   165   166   167   168   169   170   171   172   173   174