
Page 179 - OUSD LCAP 2016-19
P. 179
APPENDIX A
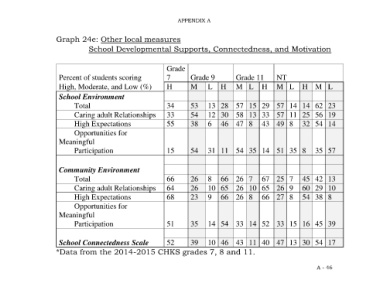
Graph 24e: Other local measures
School Developmental Supports, Connectedness, and Motivation
Grade
Percent of students scoring 7 Grade 9 Grade 11 NT
High, Moderate, and Low (%) H M L H M L H M L H M L
School Environment
Total 34 53 13 28 57 15 29 57 14 14 62 23
Caring adult Relationships 33 54 12 30 58 13 33 57 11 25 56 19
High Expectations 55 38 6 46 47 8 43 49 8 32 54 14
Opportunities for
Meaningful
Participation 15 54 31 11 54 35 14 51 35 8 35 57
Community Environment
Total 66 26 8 66 26 7 67 25 7 45 42 13
Caring adult Relationships 64 26 10 65 26 10 65 26 9 60 29 10
High Expectations 68 23 9 66 26 8 66 27 8 54 38 8
Opportunities for
Meaningful
Participation 51 35 14 54 33 14 52 33 15 16 45 39
School Connectedness Scale 52 39 10 46 43 11 40 47 13 30 54 17
*Data from the 2014-2015 CHKS grades 7, 8 and 11.
A - 46