Page 159 - OUSD LCAP 2016-19
P. 159

APPENDIX A


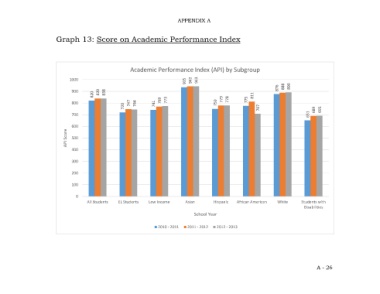
                        Graph 13: Score on Academic Performance Index


                                                       Academic Performance Index (API) by Subgroup

                              1000                                               942  943
                                                                              935
                                                                                                                     876  888  890
                               900        839  838
                                        820                                                                811
                               800                     747  744   741  769  773            750  779  778  775
                                                     720                                                     707                    689  691
                               700                                                                                                651

                               600
                             API Score  500


                               400


                               300
                               200


                               100

                                 0
                                     All Students  EL Students  Low Income    Asian       Hispanic  African American  White    Students with
                                                                                                                                Disabilities
                                                                                  School Year


                                                                   2010 - 2011  2011 - 2012  2012 - 2013


                                                                                                                                     A - 26
   154   155   156   157   158   159   160   161   162   163   164